One of the key factors contributing to the difference in customer acquisition cost between Facebook and Google advertising platforms is their respective charging models.
In general, Facebook charges based on how many ads were displayed (number of impressions), while Google charges based on the amount of traffic it brings to the website (number of clicks).
The amount that Google charges for a click depends on a number of factors such as the ad placement, level of competition, ad relevance, and so on, and it can vary from relatively small amounts like $0.10 to well over $5 per click.
For the purposes of this blog post, we assume that we are analyzing a Google Ads account for an e-commerce website.
However, the discussion can easily be extended to any website that uses Google Ads to drive traffic for which it tracks conversion actions (downloading a file, playing a video, signing up for a newsletter,…).
For all e-commerce businesses, unit economics play a central role in decision making, and one of the most important metrics is CAC, the customer acquisition cost.
For example, a CAC figure of $20/customer means that the business needs to spend, on average, $20 to acquire a new customer.
The reason why CPC is important is that combined with the conversion rate, it can be used to calculate the CAC using this formula.

The variables in the formula represent:
- CAC: customer acquisition cost,
- CPC: cost per click,
- CR: conversion rate.
The upper formula is a useful tool which can be used to assess Google Ads campaigns.
In the following example, we’ll show you how it can be used.
Example
Imagine you want to start a new prospecting campaign on Google, for example, a Search campaign targeting non-brand keywords.
Based on the company’s KPIs you know the CAC levels that are sustainable. Using the historical CR data from Google Analytics, you can estimate what the conversion rate will be for the traffic coming through the campaign. With this information, you can calculate the appropriate levels of CPC for that campaign using the formula: CPC = CAC * CR.
If the target CAC for the campaign is $45, and the historical data tells you that the conversion rate for new visitors is 2.13%, then the formula gives the CPC value of: $0.96.
One or two days after the launch of the campaign, you already have some idea of what the CPC level will be for the campaign. If after 2 days, the CPC is $0.53 for that specific campaign, then the traffic is less expensive, and the conversion rate for the campaign can go as low as 1.17%, and the campaign will still hit the target CAC.
On the other hand, if the CPC after 2 days is $2, then the conversion rate for the traffic will have to be 4.44%. If, on average, the conversion rate for new visitors is 2.13%, is it reasonable to expect from that campaign to have a conversion rate of 4.44%?
As more and more time goes on, you will have a better understanding of what the CPC levels are for the campaign. The mentioned formula then gives the lower bound on the conversion rate needed in order to reach the target KPI.
Conversion rate of campaign
If the conversion rate for the campaign is higher than the calculated value, then you’re golden and you can increase the budget for that campaign. But if the conversion rate is lower than the calculated value, then some optimisations are needed.
For example: you could stop using the most expensive keywords (or switch to a more broad keyword: from exact to phrase or broad), or even stop using the most expensive audiences.
Further still, you could work on improving the ad relevance: creating ad texts with more keywords inserted, or sending the traffic to a more relevant landing page. This can improve the quality score of the keyword, and can have a positive influence on the campaign’s CPC.
Data Visualization
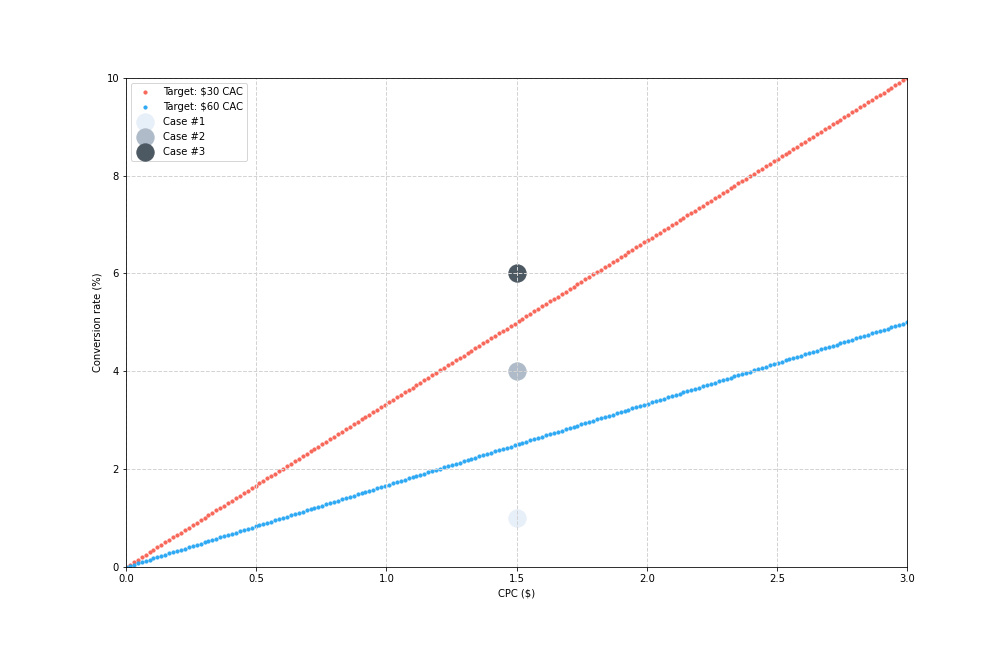
To further illustrate the points made, we will use the chart provided which plots the conversion rate against CPC figures. By rearranging the terms in the formula, we get the following expression, which tells us that the slope on the chart will be equal to 1/CAC.

The two lines provided represent the boundary cases when the goal CAC is $30/customer (red line), and the case when the goal CAC is $60/customer (blue line).
This means that all pairings of CPC and CR that are located on the blue line have CAC = $60, and all pairs located on the red line have CAC = $30.
Take for example the point (3.0, 10%) in the top right corner. By definition, it has CPC equal to $3.0, and CR of 10%. This gives the customer acquisition cost of $30.
Basically, every ad, ad group, or even campaign can be displayed on this chart, and each point will fall in one of three possible regions. To explain how to interpret those regions, we placed a single data point in each region, and for each data point we calculate the associated CAC and comment the result based on if the results are aligned with the KPI of CAC = $30 or CAC = $60:
- Case #1 (CPC = $1.5, CR = 1%): CAC = $150 → too high in both cases,
- Case #2 (CPC = $1.5, CR = 4%): CAC = $37.50 → acceptable results if the target KPI were CAC = $60/customer (blue line) but not sufficient if the target is CAC = $30/customer (red line),
- Case #3 (CPC = $1.5, CR = 6%): CAC = $25.00 → good result in both cases.
Appendix
In this section, we derive the formula that relates the customer acquisition cost with the CPC and conversion rate metrics. To facilitate comprehension, we will try to minimize the usage of algebra, and instead we rely on the interpretations of variables. First, let’s introduce the relevant quantities once more:
- Conversion rate = Number of customer / Number of website visitors
- Cost per click = Total spend / Number of clicks
- Customer Acquisition Cost (CAC) = Total spend / Number of customers.
We see that the quantities like total spend and number of customers get repeated on the right hand side. The main thing to notice is that the number of clicks is equal to the number of website visitors. Finally, using these three formulas we get the wanted expression:
Dividing by the CR we get the wanted expression.
Conclusion
The formula provided relates the KPI figure for CAC with metrics that are available on Google Analytics, in an easy and intuitive way: CAC will double if the cost-per-click doubles (and conversion rate stays the same), because you are bringing half as much traffic at the same price. In the same way, CAC will double if the conversion rate is halved (and CPC stays the same), because half as many people will convert.
Comparing the CPC and CR metrics for the campaign with some benchmark figures from Google Analytics can give some idea of what needs to be worked on if the campaign is not performing:
- If the conversion rate for the campaign is “good” (comparable to historical data from Google Analytics), then CPC needs to be lowered either by excluding the most expensive keywords/audiences or by working on improving ad relevance through new ad texts/landing pages.
- If the CPC seems reasonable (not too expensive) and the campaign is not performing, then CR needs to be improved by testing ad texts or landing pages.
This method can be used independently of the campaign’s bidding strategy. The point is to relate the tangible KPI (customer acquisition cost) with abstract performance metrics like CPC and CR.
⭐⭐⭐⭐⭐
100+ five-star reviews on Shopify App Store
to get free advertising optimization tips and exclusive insights

No comment yet, add your voice below!