
Most of you have probably read our article about why Smart Customer Targeting matters and hopefully installed our app which automatically calculates next product recommendations for your customers. Today we want to help you understand, on an intuitive level, how the product purchase history of your customers actually reveals valuable information for future recommendations.
Say hi to Marley and her tea store
It would be really rude to start without introducing you to the main character of our story: our imaginary friend Marley. Marley owns an online Shopify store selling different kinds of tea. Here is the list of products Marley sells and how many first time customers choose to buy each product.
Title | % Customers |
Black Tea Original | 50.23% |
Green Tea Original | 29.71% |
Black Tea Nougat Plum | 6.98% |
Green Tea Lemon | 5.32% |
Black Tea Orange | 4.04% |
Tea Cups | 2.87% |
Tea Filters | 0.85% |
Marley knows that her most popular products are Black Tea Original and Green Tea Original, so she mostly promotes these to her new customers. But recently she wondered if there is a better way to recommend products to her existing customers?
How buying probability changes with new data
When we target new customers, we usually don’t know anything about their taste preferences so the best we can do is to recommend the most popular products. But after a customer buys a product, they automatically reveal some information about themselves.
To check this, Marely looked at all her customers who bought Black Tea Original in their initial order and bought a different product afterwards. In the table below you can see which products customers bought as their next item.
Second product | % Customers |
Green Tea Original | 15.21% |
Black Tea Nougat Plum | 44.33% |
Green Tea Lemon | 3.37% |
Black Tea Orange | 23.41% |
Tea Cups | 10.84% |
Tea Filters | 2.82% |
Have you noticed how the preferences changed? The Green Tea Original would be the most likely next product if we looked at the table with first-product probabilities, but here it’s only in third place.
Quantifying the change
Let’s calculate the exact change in probabilities we have seen in the example above. Since we are talking about recommending the next product after buying Black Tea Original, just like in the previous table, we will omit Black Tea Original from the table.
| Product | P1 (looking only at first orders) | P2 (looking at orders after buying Black Tea Orig.) | Change after buying Black Tea Original |
| Green Tea Original | 59.69% | 15.21% | – 74.52% |
| Black Tea Nougat Plum | 14.02% | 44.33% | +216.12% |
| Green Tea Lemon | 10.69% | 3.37% | – 68.47% |
| Black Tea Orange | 8.12% | 23.41% | +188.45% |
| Tea Cups | 5.77% | 10.84% | +88.04% |
| Tea Filters | 1.71% | 2.82% | +65.32% |
Table explanation:
- P1 : This probability is the same as the percentages in the first table, taking into account that we removed Black Tea Original from the table, i.e. normalized by 49.77%. Particularly, this would be the probability of buying each product based on the number of customers which bought that product in their first order (while ignoring the Black Tea Original customers).
- P2 : The probability from the second table.
- Change: The amount for which the probability changed, i.e. P2 = (1 + change)*P1
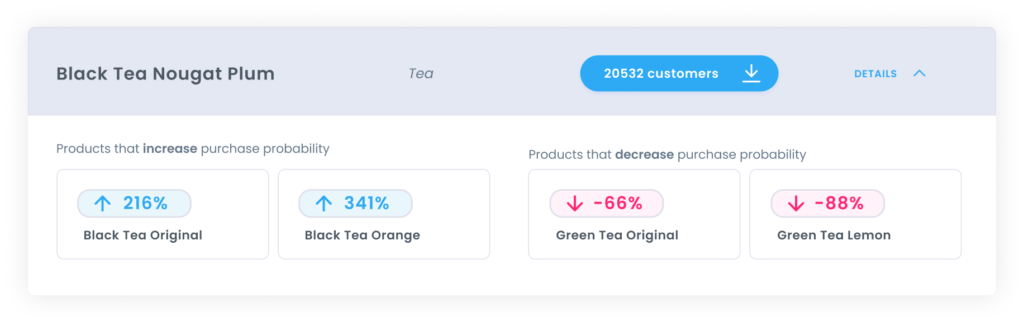
If we do this for each product, we can look at the complete probability change matrix.
To help you read the matrix, here is your cheat sheet: Customers who already bought [column name] have an increase/decrease in probability for buying [row name]. For example:
- Customers who already bought Green Tea Original have a 222% increase in probability of buying Green Tea Lemon.
- Customers who already bought Black Tea Orange have a 391% decrease in probability of buying Green Tea Original.
Translating numbers into words
What the final table shows us is a simple truth, namely that people who bought Black Tea Original probably like black tea more than green tea. Also it shows us that people probably won’t buy some add-on products like filters or cups the first time they come across your store. But after they are already familiar with it, there might be a fair probability of buying such products. Obviously, adjusting your recommendations according to a customer’s purchase history can really matter a lot.
Why calculate the obvious things?
In this example for Marley’s Tea Store you saw how the changes in probability express an underlying logic of the customer’s taste for products. Since the products are simple, the explanations were also quite easy to understand. It might seem unreasonable to calculate all those numbers if the next product recommendations seem to be out there by plain logic: of course you will recommend other black tea products to people who already bought Black Tea Original, you don’t need to look at the data to tell you that. But in more general cases, we could have different reasons that complicate our recommendation scheme.
- More products. If you would have to do all of this in your head for even a small number such as 30 products, you would probably get lost.
- Intuition or fallacy? Sometimes you think you know how customers will behave, but looking at the numbers you discover you were completely wrong.
- More complicated type of products or product structure, where the cause and consequences are not so clear to disentangle without calculations
Mind the data gap
One important thing we didn’t mention so far is that it’s important to take into account how much data you have for calculating the probability changes. Namely, some probabilities might be calculated on a small amount of data and are thus unreliable. It would be wise to set a minimum sample size for your calculations and to also do a statistical test showing if the change in probability is actually statistically significant. As usual, to detect small changes you will need a greater sample size, while drastic changes can be detected on smaller amounts of data.
The show must go on
Now you have seen the simplest next product recommendations system you could probably think of. But as shown, even this simple one, makes a difference. Imagine how much more we could do if we took on more serious mathematical and machine learning tools and even more data to help us with this task? Well, you don’t have to look far since we’ve done that for you, too. Check out how we built our final recommendation system using neural networks and don’t forget to install our app.


No comment yet, add your voice below!