
Whether you are a business owner or a consumer, you’ve probably noticed an increase in the number of subscription businesses over the last few years. Consumers love them for their convenience and business owners love them even more because of the revenue potential they bring in. Do you have a clear picture of your future earnings and make plans accordingly? Or are you surprised every time you check your monthly stats?
Do you really know your customer lifetime value?
Customer Lifetime Value (CLV) is a term used to describe the total revenue a customer will generate in the long term. Most businesses keep track of their CLV metrics, yet few of them question the methodology used to calculate one of the most important metrics for their business. The most common mistake is to calculate the average revenue generated by users so far, which is often more misleading than useful. Let’s look at the example below and imagine we are looking at those number at the end of March 2020:
Month started (cohort) | New subscribers | Revenue in 2020-01 | Revenue in 2020-02 | Revenue in 2020-03 | Total Revenue | Avg revenue per user/subscriber (ARPU) |
2020-01 | 101 | $5,201 | $3,801 | $2,100 | $11,102 | $109.92 |
2020-02 | 95 | $5,030 | $4,820 | $9,850 | $103,68 | |
2020-03 | 111 | $5,270 | $5,270 | $47.48 | ||
Total | 307 | $5,201 | $8,831 | $12,190 | $26,222 | $85.41 |
The number in the rightmost column is often used to approximate the CLV for each cohort of users (group of users which started in the same month). But obviously those three numbers are not comparable: subscribers which started in 2020-01 had more time to generate revenue and thus have the highest “CLV”. Interestingly, the 2020-02 cohort managed to accumulate approximately the same revenue per user in two months as cohort 2020-01 did in three months. This means that we expect the actual CLV in the future to be much higher for the 2020-02 cohort.
Additionally, looking at the total ARPU, it’s not really clear what it means since it’s calculated from a mix of “old” and “new” users. Let’s check out one more example to get a clearer picture of how confusing this can be. Imagine that at some point in March you had a huge campaign and started getting significantly more monthly users than previously.
Month Started | New Subscribers | Revenue in 2020-01 | Revenue in 2020-02 | Revenue in 2020-03 | Total Revenue | Avg Revenue per user/subscriber (ARPU) |
2020-01 | 37 | $2,008 | $1,908 | $1,811 | $5,727 | $154.78 |
2020-02 | 21 | $1,090 | $882 | $1,972 | $93.90 | |
2020-03 | 173 | $9,102 | $9,102 | $52.61 | ||
Total | 231 | $2,008 | $2,998 | $11,795 | $16,801 | $72,73 |
If you look at cohorts 2020-01 and 2020-02 you can see that the revenue coming in from subscribers each following month is just around 5-20% lower than the previous month which indicates really high retention of subscribers. In the future these subscribers will generate a lot more revenue than measured so far. But when calculating the total ARPU, most of the subscribers entering the calculation are only one month old and have current ARPU of $52.61 which results in a total ARPU of only $73 which is much lower than would be reasonable to expect. This is obvious if you think of the total ARPU as the weighted sum of ARPU per cohort:
Total ARPU = (173*$52.61 + 21*$93.90 +37*$154.78) / (173 + 21 + 37)
What we can conclude from this is not that ARPU is an unimportant metric, but that there is an additional metric that we find crucial here – the expected CLV. What the expected CLV is telling us is, based on the performance of a cohort so far, how much do we expect the actual CLV to be in the long term. The expected CLV can be compared between cohorts and give us a meaningful way of looking at our performance over time.
When do we need more advanced methods?
In some industires predicting something like the expected CLV is not useful because of a high turnover rate. Mobile app users are expected to interact daily with the product and churn relatively quickly, so you can calculate the actual CLV after only a month or two.
That is, after most of the customers churn you can say that ARPU is approximately the same as CLV and there is no need to estimate anything
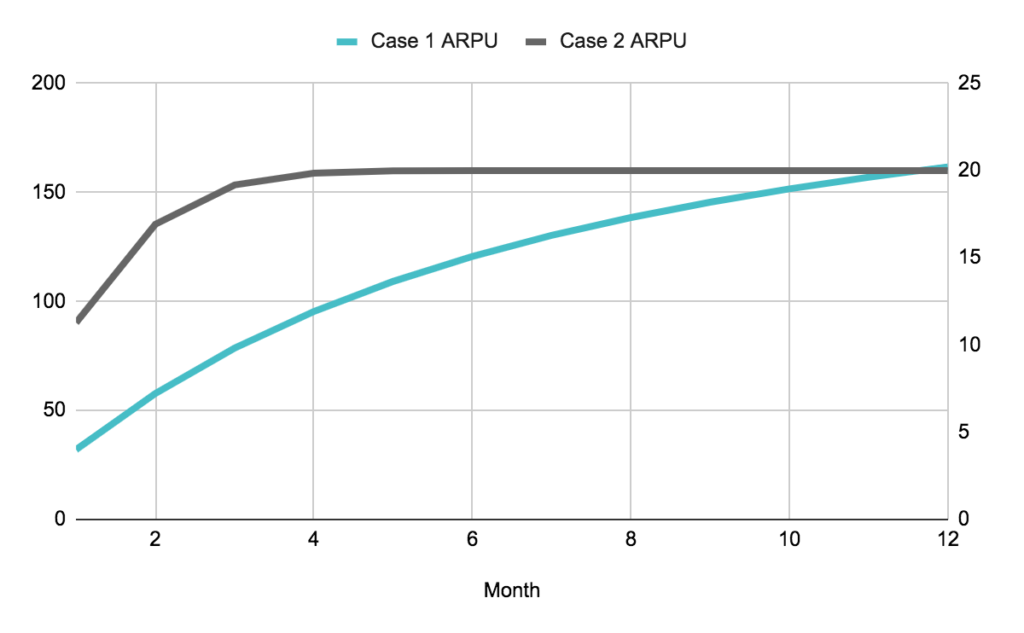
Let’s compare the ARPU between slow churn (monthly software license) and fast churn (mobile game) data. We are looking at one cohort over a year, assuming that the software started with 100 users and in the game with 300 users (which doesn’t impact our conclusion in any way).
Monthly revenue | ARPU until month | |||
Month | Software license | Mobile game | Software License | Mobile game |
1 | $3,209 | $3,384 | $32 | $11 |
2 | $2,567 | $1,692 | $58 | $17 |
3 | $2,079 | $677 | $79 | $19 |
4 | $1,684 | $203 | $95 | $20 |
5 | $1,381 | $41 | $109 | $20 |
6 | $1,146 | $4 | $121 | $20 |
7 | $963 | $0 | $130 | $20 |
8 | $819 | $0 | $138 | $20 |
9 | $704 | $0 | $146 | $20 |
10 | $612 | $0 | $152 | $20 |
11 | $533 | $0 | $157 | $20 |
12 | $474 | $0 | $162 | $20 |
You can see how the ARPU stabilizes in the case of the mobile game much faster than with the subscription software. For the game, the ARPU for month 3 and month 12 differ by only 5%. On the other hand, if we look at the software the difference is more than double. That is why we can confidently estimate the mobile game CLV with the ARPU.
On the other hand, if you are selling a monthly subscription and after three months 60% of your users still have an active subscription, you can not just ignore the future earnings they will bring to you.
The unintelligent soltuion would be to wait a year to aproximate the CLV better, but if you want to make your business a successful one, you can’t wait a year to make estimations of future revenue streams. You have to be quick even when the data is slow.
The impact of doing it right
If the above was not convincing enough for you, we will leave you with a motivating graph.
Imagine the you have:
- A customer acquisition cost of 45$
- An average order valueof 20$
- A monthly retention rate of 80%.
Due to the difference between your AOV and CAC, you need to invest to acquire new customers, hoping for a future return.
You can choose between the following:
- Slow growth: 2 additional new customers every month .
- Medium growth: 5 additional new customers every month.
- Fast growth: 10 additional new customers every month.
The graph below shows that going into higher growth also means a larger investment and higher risk, but also significantly higher earnings in the future.
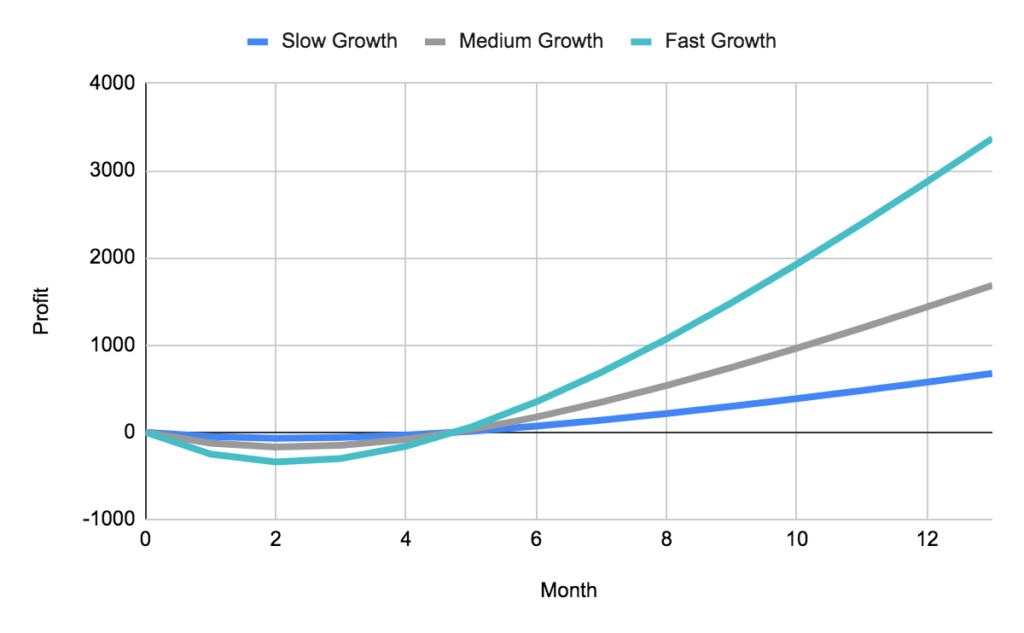
If you know how to project your future earnings, you also know how much you can invest in acquiring customers right away. While being conservative can be alright, you can often achieve far more than alright with a bit of early aggression and a heavy starting investment.


No comment yet, add your voice below!